ATF has released its annual Firearms Commerce in the United States Statistical Update for 2018. As my one friend put it, “Let the nerdery begin.” To be fair, you have to be pretty nerdy to enjoy this stuff, hence me writing about it.
The Annual Firearms Manufacturing and Exportation Report (AFMER) is only current through 2016. This is because AFMER data is not published until one year after the close of a calendar reporting year because the information provided by those whole filed a report is protected from immediate disclosure by the Trade Secrets Act. Which is why you see a two year lag (2016 data reporting in the beginning of 2017 and a year delay between its reporting and publication).

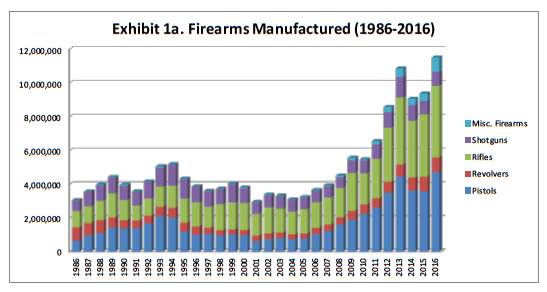
In 2016, there were a total of 11,497,441 firearms manufactured. This was up from 2015’s number of 9,358,661 by about 20%. The number of exports was up from the previous year by about 9%, from 343,456 in 2015 to 376,818 in 2016.
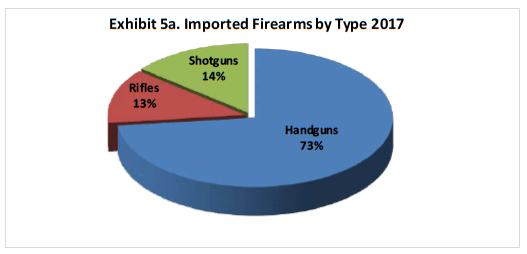
The total number of imports fell from 5,137,771 in 2016 to 4,492,256 in 2017 (imports are not included not the AFMER report which is why the numbers are more current). Once again, the number of handguns imported accounts for over half the total number of firearms imported.
For those of you NFA junkies, in 2017, there was $6,371,000 in occupational taxes paid (SOTs). This is up again from the year prior and slightly under double that of 2012. Taxes paid were $22,972,00 for 2017, about a third of what was paid in 2016 ($62,596,000). Interestingly, there were 6,749 record checks, which means that ATF searched the National Firearms Registration and Transfer Record (NFRTR) that many times to determine if a firearm was possessed lawfully or if the transfer was performed lawfully. That number is up 202 times from 2016.
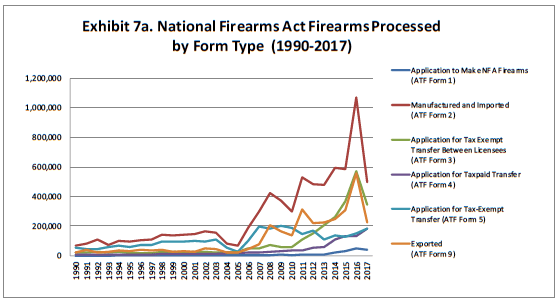
In 2017, there were 40,444 Form 1s and 184,312 Form 4s filed. These numbers were different from the year prior, but not by a significant margin for the Form 1s (Form 1s were down by about 9,000 but Form 4s were up about 51,000). The total number of forms processed by the NFA Branch was down about a million from the year prior. 2017 number look similar to that of 2014 and 2015.
As far as NFA firearms registered by state, Texas still leads with 637,612. Florida follows with 377,2017. California (thanks Hollywood), Virginia and Pennsylvania round out the top 5. Florida leads the charge with registered machine guns, sitting at 44,484. Texas has an astonishing 265,597 registered silencers. Florida is the next closest with 98,972 registered silencers.
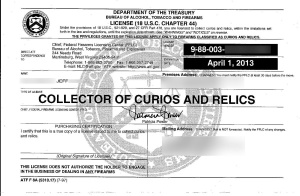
There are currently 55,588 licensed collectors of curios or relics, making it the most popular license type. It is followed closely by dealer in firearms, of which there are 56,638 active licenses. ATF reports 136,081 total active licenses (across the spectrum). Texas holds 10,920 of those licenses, making it the state with the most.
In 2017, 17 license applications were denied. This number is up exactly one from the year prior. As for compliance inspections, ATF performed 11,009 last year. This equates to 8.09% of all licensees in 2017 being inspected.
As always, the annual report helps give some insight as to ongoings within the firearms industry.

How ironic,
ATF allows one of the highest NFA transfers in the U.S. for a Anti-Gun State, (California) to a Hollywood practice that generally is Anti-2A.
I guess money can and DOES buy corrupt practices in the U.S.
PS. I served my Country for over 20 yrs (w/10 yrs OCONUS), and live in the Free State of Arizona, (where our State Constitution guarantees individual gun ownership).
Another THANK YOU to the you and the group of Attorneys that support the 2nd Amendment.
God Bless and keep up the good work!
LikeLike